Blog
Making research, innovation and entrepreneurship policy in the big data era: a summary of the discussion at the IGL2017 Global Conference
5 July 2017
The data revolution is transforming our economy and society, from the way we shop to the way we date. But what about Research, Innovation and Growth (RIG) policy?
Somewhat ironically, RIG policymakers who support cutting edge ideas in academia and industry have not themselves been too innovative in their use of new data sources and analytics. Business surveys, patents and publications remain the data workhorse in this domain, same as they were 10 years ago. Yet these data sources, valuable as they are, present some important limitations which make them less useful for RIG policymakers: they are by definition based on old categories (e.g. industrial codes) which make them irrelevant for the analysis of new industries, they capture imperfectly or not at all innovation networks and industries that do not patent or publish, and they are not very relevant for important actors in the innovation system such as entrepreneurs or investors, who want detailed (rather than aggregate) data about who to collaborate with and fund.
In recent years, policymakers and researchers have started looking for ways to overcome these challenges with new data sources and analytics offering a more timely, holistic and detailed view of the innovation system.
These experiments range from measuring the digital economy and the video games industry with data ‘scraped’ from company websites and business directories, to using information about tech meetups to map collaboration networks in the creative sector. The results are increasingly made available in interactive data visualisations and dashboards that encourage data exploration by a multitude of actors. We at Nesta are exploring some of these opportunities with Arloesiadur, the innovation dashboard for Welsh Government we will soon be launching, and have summarised the state of play in New Data for Research and Innovation Policy, a paper we presented at the 2016 OECD Blue Sky Conference.
In June 2017, the IGL Global Conference included a parallel session where we learnt about some of these ‘data innovations in innovation policy’, and considered what they mean for RIG policy.
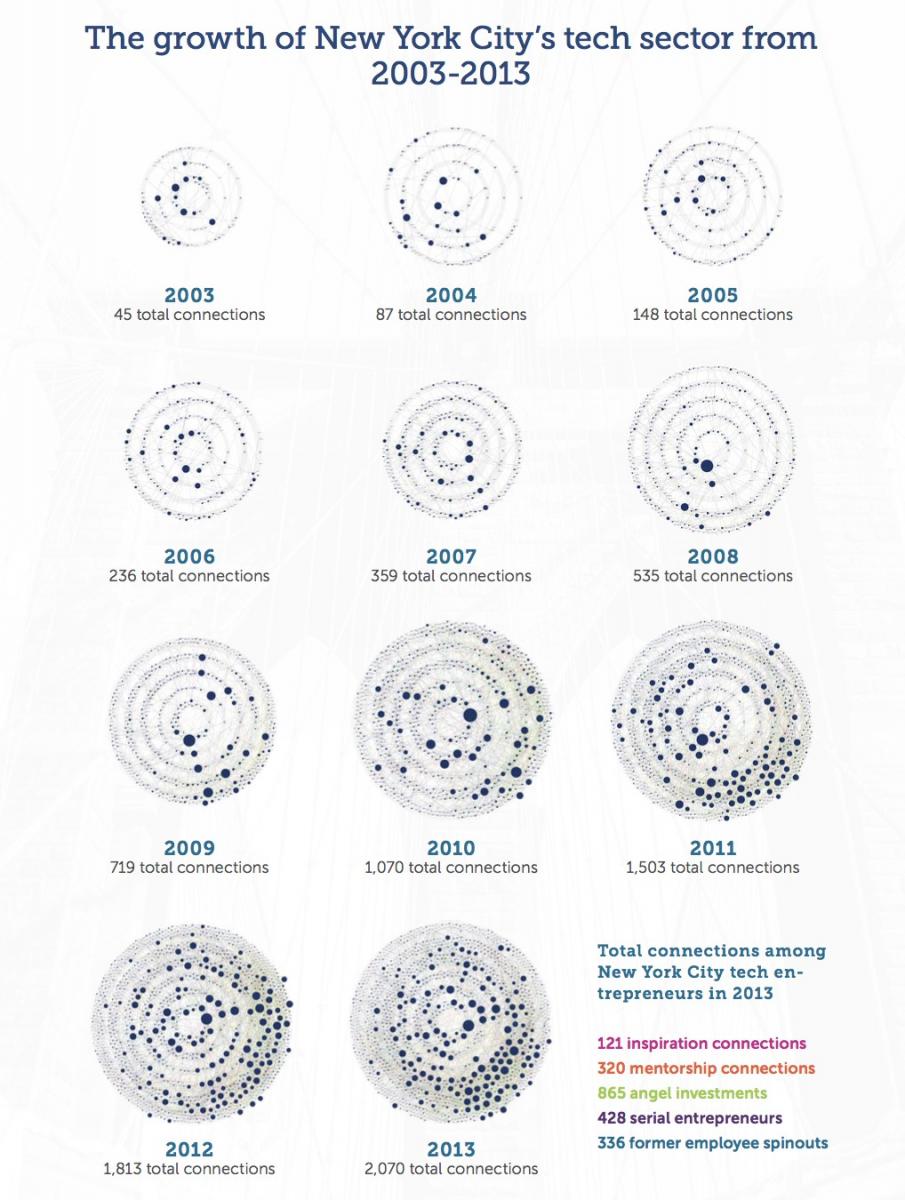
Rhett Morris, Director of Research at Endeavor Insight told us about their work mapping entrepreneurial ecosystems through a combination of surveys, LinkedIn data and striking network visualisations that provide a comprehensive picture of the state of a start-up ecosystem and its evolution (see figure below). The results can often be surprising. For example, Endeavor’s analysis of the New York entrepreneurial ecosystem reveal that many of the founders do not come from Science, Technology, Engineering and Mathematics (STEM) disciplines, and that they are older than generally assumed. It also shows that ‘networked altruism’ (mentoring and inspiring new entrepreneurs) is highly beneficial for the health of the ecosystem, and the success of the altruists themselves.

This diagram shows the levels of entrepreneurial activity and connections between organisations at different stages in the evolution of the NYC ecosystem. Source
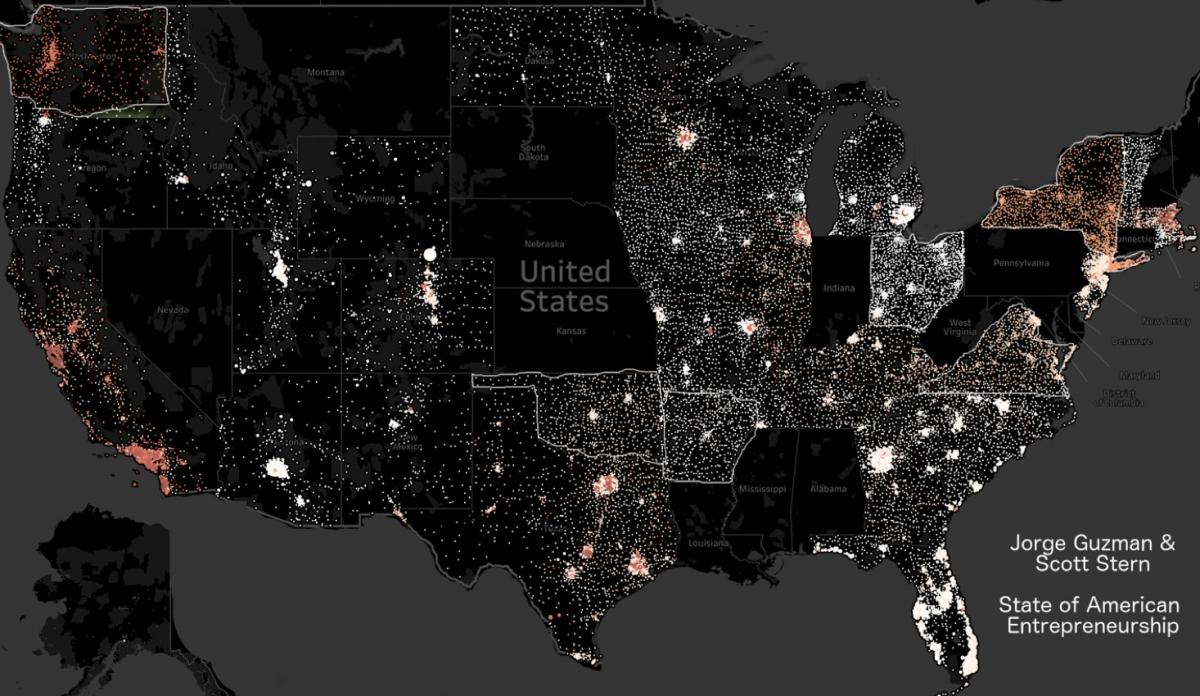
Scott Stern, Economics Professor at MIT, described his research ‘nowcasting’ and ‘placecasting’ entrepreneurship in the USA: Scott and his co-author Jorge Guzman train machine learning models with open data (including business registration and patenting data) to identify factors associated with high impact entrepreneurship, and then use those models to generate predictions about where this entrepreneurship is happening right now. These analyses shed light on the geography of innovation in the USA, helping define in detail the boundaries of high growth clusters; they also suggest that in spite of the well-documented slowdown in start-up formation in the USA, businesses with the potential to become high-impact are still being created apace.

This map displays levels of entrepreneurship in different parts of the USA. The orange colour represents higher probability of high impact entrepreneurship, based on Guzman and Stern’s predictive model. Source.
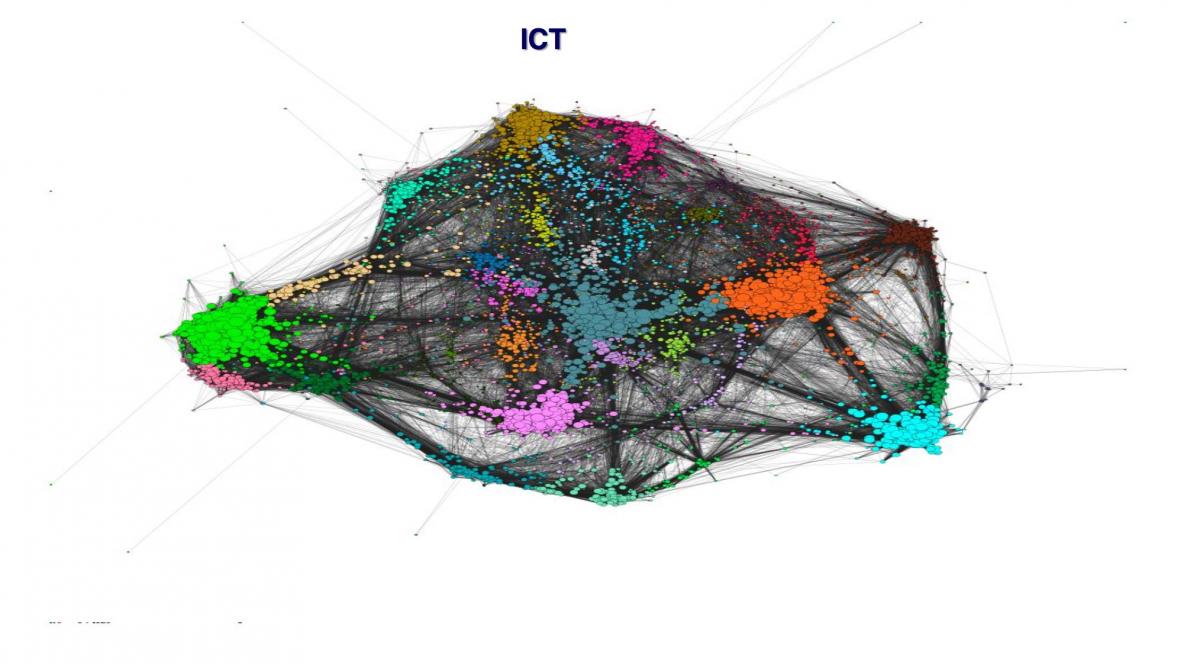
Clara Eugenia García, Director General of Research, Development and Innovation at the Spanish Ministry of Economy, Science and Technology, spoke about the ongoing transformation in the use of data to monitor and inform Research and Development (R&D) policies in the Ministry. This involves combining data from many different sources (e.g. grant applications, administrative data, official surveys and research outputs), analysing the data using Natural Language Processing (NLP) that turns project descriptions into metrics about their specialisation in different research topics, and putting the resulting information at the fingertips of policymakers with interactive dashboards and visualisations.

This network graph shows the relations between research topics in the grants within the ICT discipline received by an institution. Source: Clara Eugenia García’s IGL Global Conference presentation.
In the panel discussion after the presentations, we talked about potential strategies to take analytics experiments into the RIG policy mainstream, addressing policymaker concerns with data representativeness and quality, and with ‘black box’ models that are difficult to understand and explain.
The panel pointed out that we need to set these limitations in the context of a data status quo that leaves much to be desired, and where some data is becoming meaningless. This means not turning the perfect into the enemy of the good, acknowledging the limitations of existing tools and using them wisely. In particular, we should embrace new opportunities to engage innovators and entrepreneurs who do not see themselves reflected in out-of-date, aggregate official statistics, and to measure activity in low-tech or manufacturing industries often ignored by RIG policymakers. New data can help build a shared understanding of the situation of innovation systems and ecosystems, supporting collaborative policies to drive innovation such as MIT’s REAP programme. However, before getting started with an innovative analytics project in policy, it is also critical to ensure that the organisation is ready to absorb and apply the results.
I left the session feeling very energised: although there is a lot of work to do bringing data analytics into the toolkit of RIG policymakers, the demand is clearly there.
With new data and methods, we can understand innovation systems and entrepreneurial ecosystems much better, use more open and collaborative approaches to design and implement policies, and track their impacts more accurately, even measuring how policies drive change in the structure of complex networks that until now have remained hidden. As we know from studies of technology adoption in many other sectors, realising these benefits will require a great deal of experimentation, new processes and skills in RIG organisations. We look forward to working with policymakers on this journey to bring RIG policy into the big data era.
